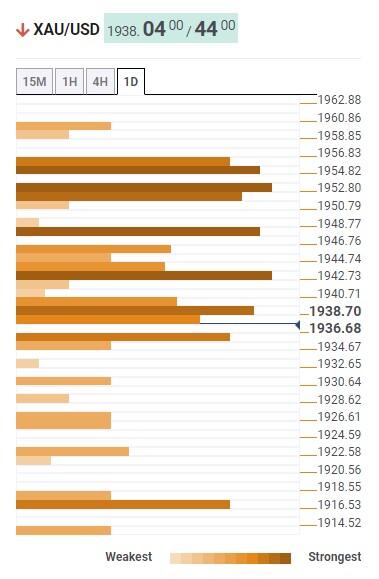
The TCD (Technical Confluences Detector) is a tool to locate and point out those price levels where there is a congestion of indicators, moving averages, Fibonacci levels, Pivot Points, etc. If you are a short-term trader, you will find entry points for counter-trend strategies and hunt a few points at a time. If you are a medium-to-long-term trader, this tool will allow you to know in advance the price levels where a medium-to-long-term trend may stop and rest, where to unwind positions, or where to increase your position size.
XAU/USD sellers eye $1,915 and US inflation – Confluence Detector
منبع: https://www.fxstreet.com/news/gold-price-forecast-xau-usd-sellers-eye-1-915-and-us-inflation-confluence-detector-202308070503
About Technical Confluences Detector
Above all, the middle band of Bollinger on one-day, Fibonacci 61.8% on one-week and 38.2% on one-month appear a tough nut to crack for the Gold buyers near $1,955.
That said, Fibonacci 61.8% on one-month, around $1,935 by the press time, acts as the last defense of the Gold buyers, a break of which could quickly drag the quote toward $1,915 support confluence encompassing Pivot Point one-month S1 and one-day S2.
Apart from that, the Gold market’s consolidation ahead of festive demand from India, one of the key customers of XAU/USD, also keeps the metal prices down ahead of the key data/events from the US.
It’s worth noting that the Gold Price weakness past $1,915 will make it vulnerable to testing the $1,900 threshold.
Following that, the previous daily high and the upper band of the Bollinger on the hours chart could test the XAU/USD run-up near $1,948.
In a case where the Gold Price remains firmer past $1,948, the 10-DMA level of around $1,952 can check the metal’s further upside.
Also read: Gold Price Forecast: XAU/USD needs validation from 50 DMA to extend the recovery
Gold Price: Key levels to watch
That said, the XAU/USD traders should keep their eyes on Thursday’s US Consumer Price Index (CPI) and Friday’s Producer Price Index (PPI) for July for clear directions. Should the inflation data arrive as positive, the Gold sellers can break the stated key support line stretched from October 2022, which in turn will be detrimental for the bulls.
In a case where the XAU/USD remains bullish past $1,955, the $1,960 resistance encompassing Pivot Point one-day R2 will act as the final defense of the bears.
Here is how it looks on the tool
Gold Price (XAU/USD) remains on the backfoot as it retreats toward a $1,915 support confluence amid a broad US Dollar rebound, as well as mixed mood, ahead of the scheduled inflation clues from the US, China, Australia and New Zealand. Also important will be this week’s UK growth numbers and China trade data as the market struggles for clear directions.
As per our Technical Confluence indicator, the Gold Price remains well beneath the jungle of resistances surrounding $1,940-60, which in turn joins a comparative space towards the south before hitting $1,915 support to lure the XAU/USD sellers.
- Gold Price fades corrective bounce off one-month low, stays below jungle of resistances.
- Hawkish Fed talks, pre-data positioning defend US Dollar bulls and weigh on XAU/USD price.
- US inflation clues will be crucial to determine September Fed rate hike and can drown XAU/USD towards $1,915 support confluence.
- Post-NFP fall joins fears of Fed policy pivot, China stimulus to put a floor under the Gold Price.
Alternatively, Fibonacci 23.6% on one-day and 38.2% on one-week restricts the immediate upside of the Gold Price near $1,940.
It’s worth noting that Friday’s downbeat prints of the US Nonfarm Payrolls (NFP) joined the mixed Fed signals to trigger the US Dollar’s retreat from a multi-day high, which in turn allowed the Gold Price to recover from a multi-day-old support line. However, the weekend comments from Fed Governor Michelle Bowman appear hawkish and join the looming geopolitical fears surrounding China to exert downside pressure on the XAU/USD.
